Attention: Here be dragons
This is the latest
(unstable) version of this documentation, which may document features
not available in or compatible with released stable versions of Godot.
Checking the stable version of the documentation...
Hotspot
Voir aussi
Please see the sampling profiler instructions for more information.
Ouvrez HotSpot. Cliquez sur Record Data :
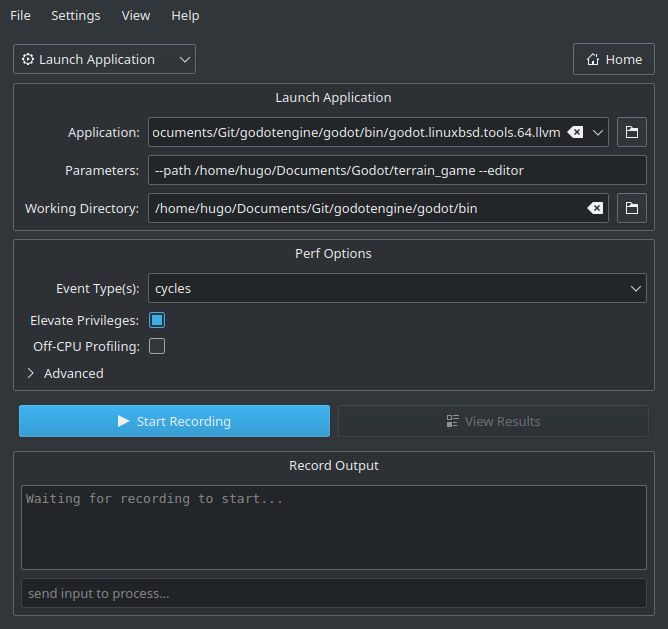
Dans la fenêtre suivante, indiquez le chemin d'accès au binaire Godot qui inclut les symboles de débogage.
Spécifiez les arguments de la ligne de commande pour exécuter un projet spécifique, avec ou sans l'éditeur.
The path to the working directory can be anything if an absolute path is used for the
--pathcommand line argument. Otherwise, it must be set so that the relative path to the project is valid.Make sure Elevate Privileges is checked if you have administrative privileges. While not essential for profiling Godot, this will ensure all events can be captured. Otherwise, some events may be missing from the capture. Your settings should now look something like this:
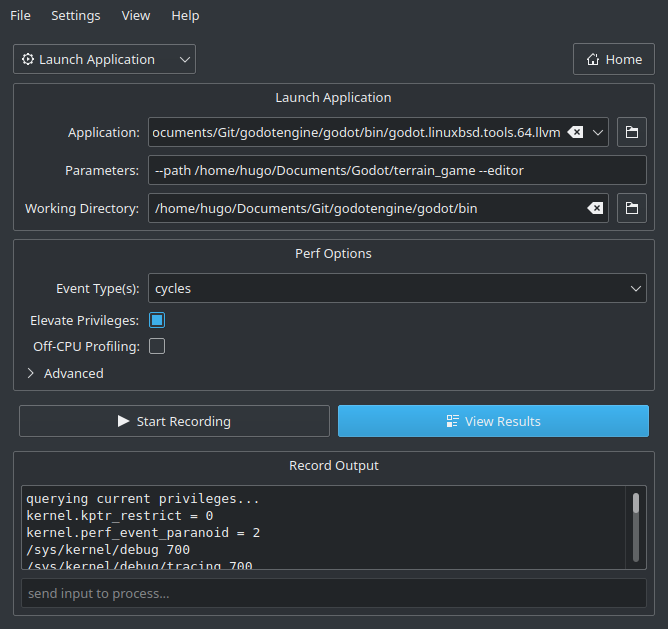
Cliquez sur Start Recording et effectuez les actions que vous souhaitez profiler dans l'éditeur/le projet.
Quit the editor/project normally or use the Stop Profiling button in Hotspot to stop profiling early. Stopping profiling early can result in cleaner profiles if you're not interested in the engine's shutdown procedure.
Cliquez sur View Results et attendez que la visualisation du profilage soit générée :
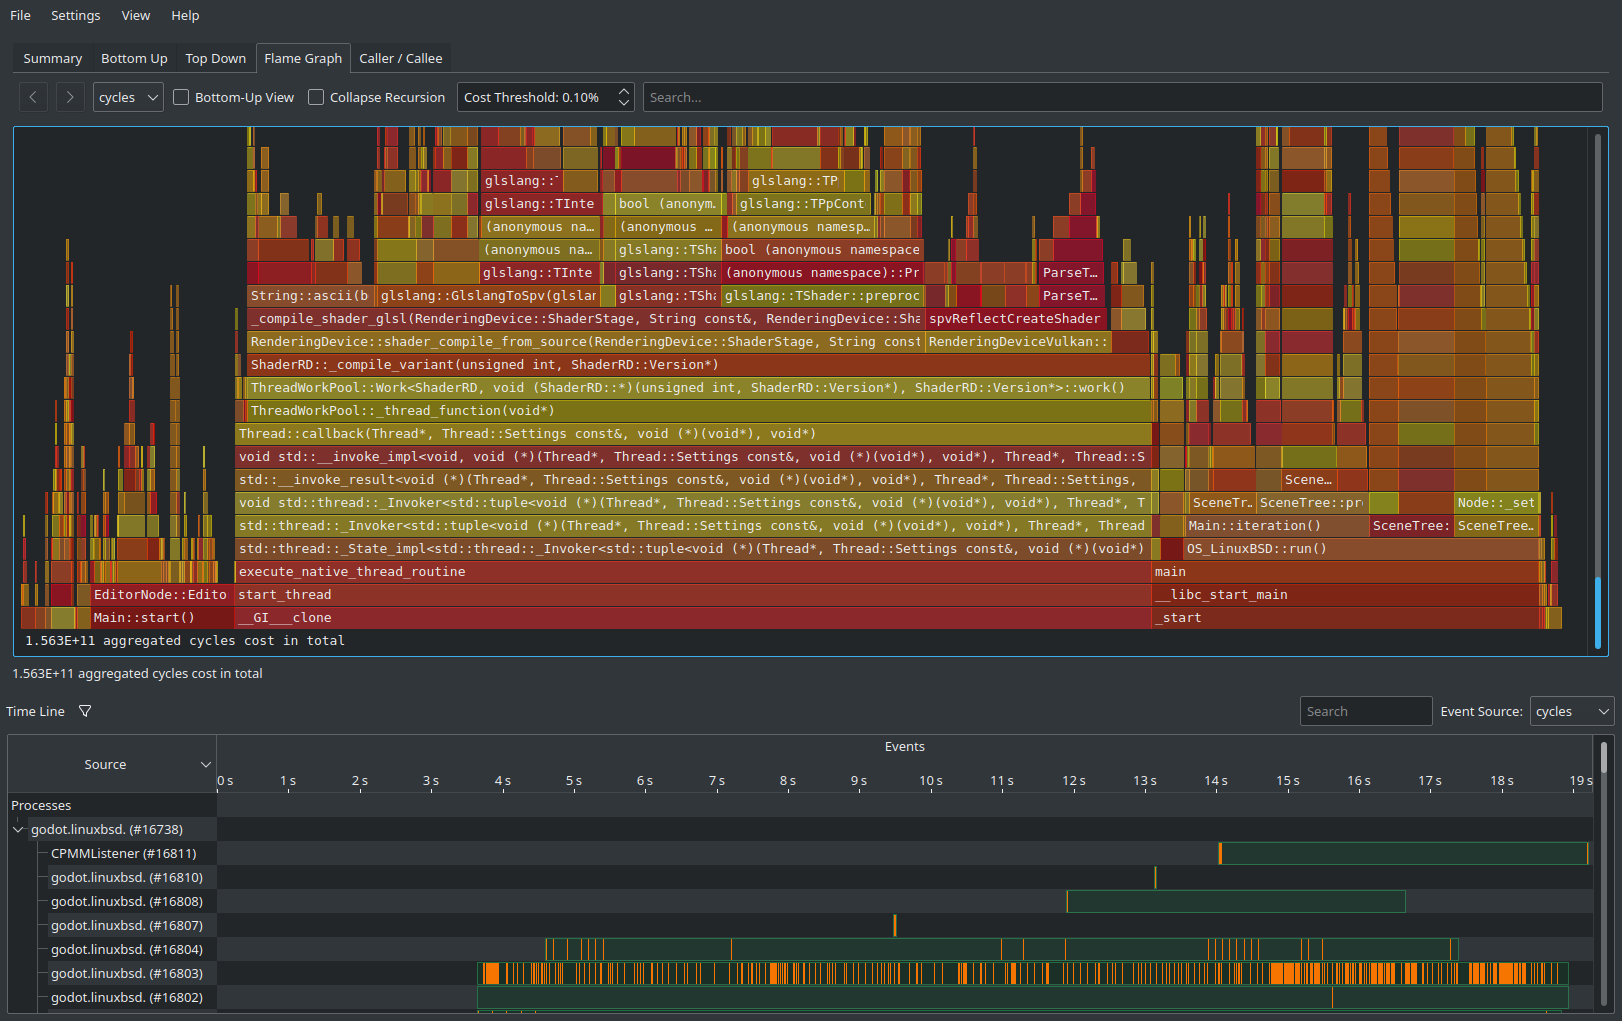
Utilisez les onglets en haut de la page pour naviguer entre les différentes vues. Ces vues présentent les mêmes données, mais de manière différente. L'onglet Flame Graph est un bon moyen de voir en un coup d'œil quelles fonctions prennent le plus de temps. Ces fonctions sont donc les plus importantes à optimiser, car c'est en les optimisant que vous améliorerez le plus les performances.
At the bottom of all tabs except Summary, you will also see a list of CPU threads started by the engine along with the CPU utilization for each thread. This lets you see threads that can be a bottleneck at a given point in time.
Note
If you don't want the startup procedure to be included in the profile, you can also attach Hotspot to a running process by clicking Record Data then setting the Launch Application dropdown option to Attach To Process(es).
Ce flux de travail basé sur l'attachement au processus est similaire à celui utilisé par VerySleepy.