Attention: Here be dragons
This is the latest
(unstable) version of this documentation, which may document features
not available in or compatible with released stable versions of Godot.
Checking the stable version of the documentation...
Instruments
Voir aussi
Please see the sampling profiler instructions and the tracing profiler instructions for more information.
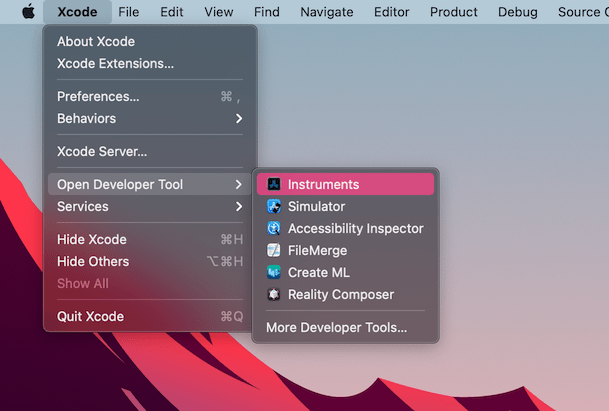
Open Xcode. Select Open Developer Tool - Instruments from the Xcode app menu:
Double-cliquez sur Time Profiler dans la fenêtre Instruments :
In the Time Profiler window, click on the Target menu, select Choose target... and specify the path to the Godot binary, command line arguments, and environment variables in the next window.
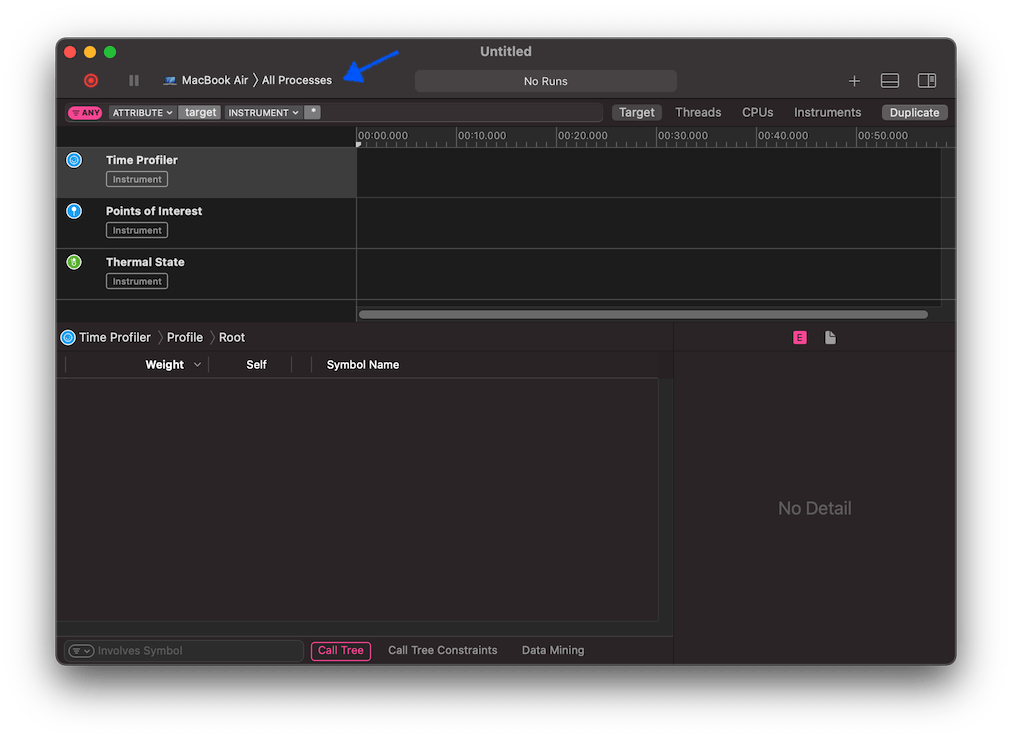
Vous pouvez également attacher le Time Profiler à un processus en cours d'exécution en le sélectionnant dans le menu Target.
Cliquez sur le bouton Start an immediate mode recording pour commencer le profilage.
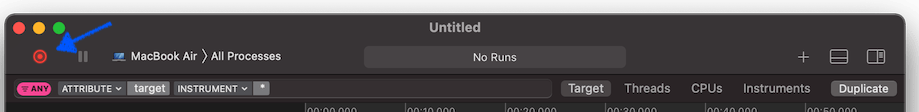
Effectuez les actions que vous souhaitez profiler dans l'éditeur ou le projet. Lorsque vous avez terminé, cliquez sur le bouton Stop.
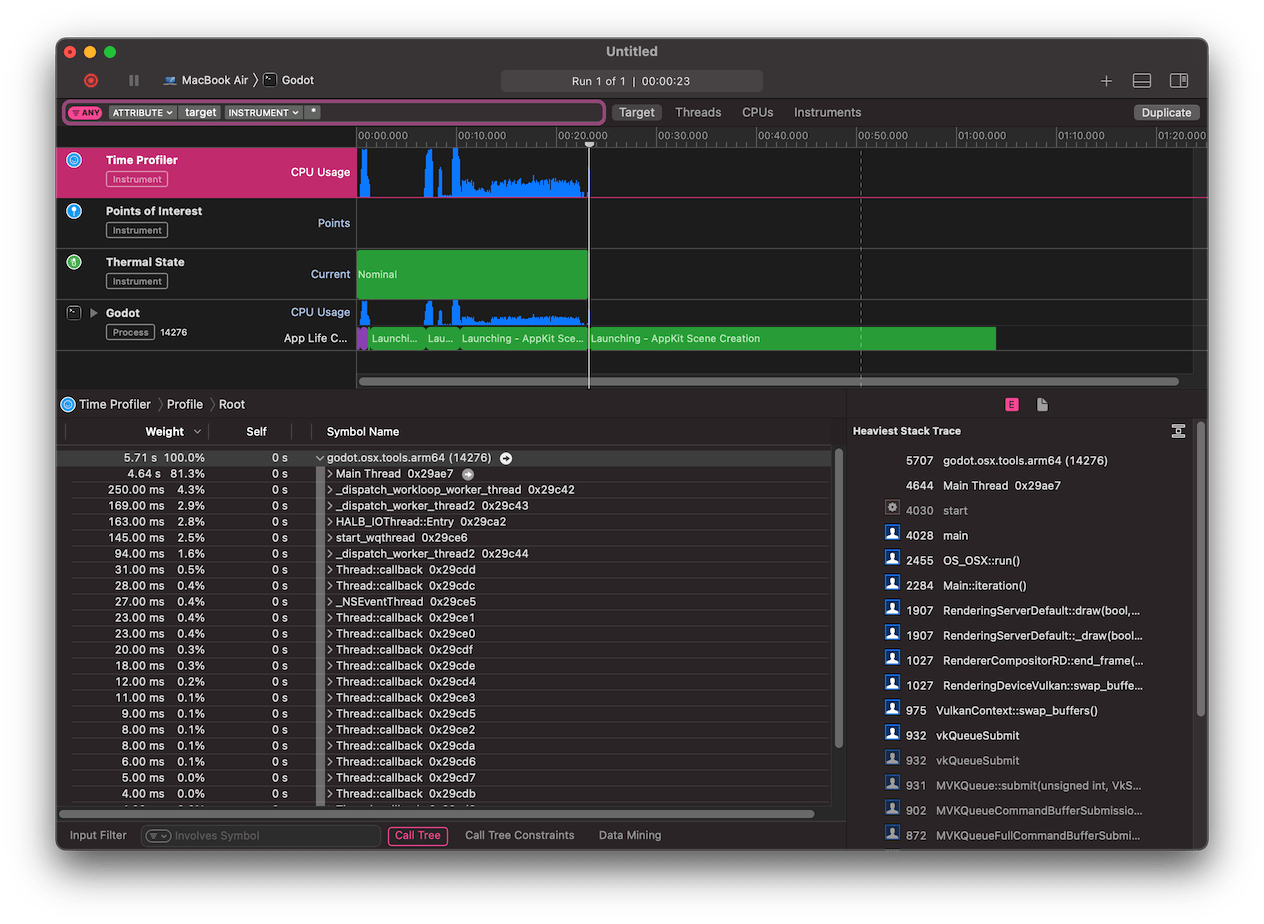
Attendez que les résultats s'affichent.
En bas de la fenêtre, vous verrez un arbre d'appel pour tous les threads CPU lancés, et la vue d'ensemble du Heaviest Stack Trace.
Select Hide system libraries in the Call Tree menu (at the bottom of the window) to remove external modules.
Vous pouvez utiliser la ligne de temps en haut de la fenêtre pour afficher les détails pour une période spécifique.